LogicFlow 流程图框架
LogicFlow 流程图框架
文档:https://site.logic-flow.cn/ 仓库地址:https://github.com/didi/LogicFlow 关于 issue:https://github.com/didi/LogicFlow/issues 相关文章:https://site.logic-flow.cn/docs/#/zh/article/article01 CodeSandbox 示例:https://codesandbox.io/p/sandbox/logicflow-base26-ztpvtv
LogicFlow 是一款流程图编辑框架,提供了一系列流程图交互、编辑所必需的功能和灵活的节点自定义、插件等拓展机制。 LogicFlow 支持前端研发自定义开发各种逻辑编排场景,如流程图、ER 图、BPMN 流程等。在工作审批配置、机器人逻辑编排、无代码平台流程配置都有较好的应用。
LogicFlow 分为:
core包 - 核心包extension包 - 插件包(不使用插件时不需要引入)engine包 - 执行引擎
1. 安装依赖
# npm
npm install @logicflow/core --save
npm install @logicflow/extension --save

# yarn
yarn add @logicflow/core
yarn add @logicflow/extension
2. 初始化画布
<template>
    <div class="container" ref="container"></div>
</template>

<script setup lang="ts">
    import LogicFlow from "@logicflow/core";
    import "@logicflow/core/dist/style/index.css";
    import "@logicflow/extension/lib/style/index.css";
    import {onMounted, ref} from "vue";
    import {Menu, MiniMap, SelectionSelect} from "@logicflow/extension";
    import UserTask from "@/node/UserTaskNode.ts"

    const container = ref(null);

    // 图数据
    const graphData = {
        nodes: [
            {
                id: "node_id_1",
                type: "UserTask",
                x: 100,
                y: 100,
                text: {x: 100, y: 100, value: "节点1"},
                properties: {
                    isPass: true
                },
            },
            {
                id: "node_id_2",
                type: "circle",
                x: 200,
                y: 300,
                text: {x: 200, y: 300, value: "节点2"},
                properties: {
                    isPass: false
                },
            },
        ],
        edges: [
            {
                id: "edge_id",
                type: "polyline",
                sourceNodeId: "node_id_1",
                targetNodeId: "node_id_2",
                text: {x: 139, y: 200, value: "连线"},
                startPoint: {x: 100, y: 140},
                endPoint: {x: 200, y: 250},
                pointsList: [
                    {x: 100, y: 140},
                    {x: 100, y: 200},
                    {x: 200, y: 200},
                    {x: 200, y: 250},
                ],
                properties: {},
            },
        ],
    };

    // 渲染画布
    let lf;
    onMounted(() => {
        lf = new LogicFlow({
            // container: document.querySelector('.logic-container'),
            container: container.value,
            autoExpand: false,
            hoverOutline: false,
            edgeSelectedOutline: false,
            stopScrollGraph: true,
            stopZoomGraph: true,
            stopMoveGraph: true,
            adjustEdgeStartAndEnd: true,
            multipleSelectKey: "meta",
            plugins: [MiniMap, SelectionSelect, Menu],
            keyboard: {
                enabled: true,
                shortcuts: [
                    {
                        keys: "backspace",
                        callback: () => {
                            const {edges} = lf.getSelectElements();
                            // 默认只支持删除选中连线
                            // bug :选中连线,可以删除,但是连线没有点击选中效果
                            if (edges && edges.length === 1) {
                                lf.deleteEdge(edges[0].id);
                            }
                        },
                    },
                ],
            },
            grid: true
        });

        // 注册自定义节点、边
        lf.register(UserTask)

        // 将图数据渲染到画布上
        lf.render(graphData);

    })
</script>

<style scoped>
    .container {
        padding: 1vh 1vw;
        width: 98vw;
        height: 98vh;
    }
</style>
4. 自定义节点
(1)定义节点
// src/node/UserTaskNode.ts
// UserTaskNode 用户任务节点

import {RectNode, RectNodeModel} from "@logicflow/core";

class UserTaskModel extends RectNodeModel {

    // 自定义节点的形状属性
    initNodeData(data) {
        super.initNodeData(data);
        this.width = 100;
        this.height = 80;
        this.radius = 5;
    }

    // 自定义节点的样式属性
    getNodeStyle() {
        const style = super.getNodeStyle();
        // 重新定义 UserTask 边框为蓝色 stroke: blue。
        style.stroke = "blue";
        style.strokeDasharray = "3 3";
        return style;
    }
}

class UserTaskView extends RectNode {
}

export default {
    type: "UserTask",
    view: UserTaskView,
    model: UserTaskModel,
};
从上面的代码,可以看到,在自定义一个节点的时候,我们需要定义节点的 model 和 view。
这是因为由于 LogicFlow 基于 MVVM 模式,所有自定义节点和连线的时候,我们需要自定义 view 和 model。
大多数情况下,需要通过重写定义 model 上获取样式相关的方法 和 重写 view 上的 getShape 来定义更复杂的节点外观。
注意如果不在model中设置形状属性,而是直接在view中直接定义生成图形的宽高这种形状属性,会出现锚点位置、 outline 大小不正确的情况。同时,连线的位置也可能会出现错乱。
(2)注册节点
import UserTask from "@/node/UserTaskNode.ts"

// 注册自定义节点、边
// 只注册一个
lf.register(UserTask)

// 批量注册
lf.batchRegister([UserTask, start, end])
(3)基于 properties 属性自定义节点样式
在实际业务中,存在这样的情况,例如在审批场景中,自定义的审批节点存在 3 种状态:
一种是流程还没有走到这个节点的默认状态,一种是流程审批通过状态,一种是审批不通过的驳回状态。
在外观上我们需要对不同的状态显示不同的颜色。LogicFlow 的图数据中提到,不论是节点还是边, LogicFlow 都保留了 properties 字段,用于给开发者存放自己的业务属性。
示例如下,properties 的 status 属性就是一个自定义的业务属性,开发者在自定义节点样式的时候, 可以基于 properties 中的属性来控制节点显示不同的样式。
// src/node/UserTaskNode.ts
class UserTaskModel extends RectNodeModel {
    initNodeData(data) {
        super.initNodeData(data);
        this.width = 100;
        this.height = 80;
        this.radius = 5;
    }

    getNodeStyle() {
        const style = super.getNodeStyle();
        const properties = this.properties;
        if (properties.status === "pass") {
            style.stroke = "green";
        } else if (properties.status === "reject") {
            style.stroke = "red";
        } else {
            style.stroke = "rgb(24, 125, 255)";
        }
        return style;
    }
}
提示如果不了解为什么 this.properties 打印出来是一个 Proxy 对象, 无法看到属性。 请查看 issue https://github.com/didi/LogicFlow/issues/530
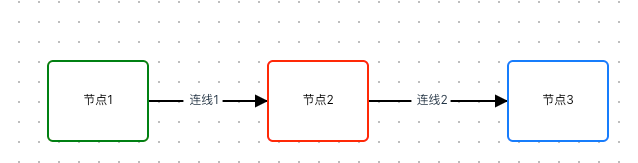
效果图:
(4)进阶:自定义节点的 view【定义更加复杂的节点】
LogicFlow 在自定义节点的 model 时,可以定义节点的基础形状、样式等属性。 但是当开发者需要一个更加复杂的节点时,可以使用 LogicFlow 提供的自定义节点 view 的方式。
5. 自定义边
6. 保存数据
<template>
    <button @click="saveGraphData">保存数据</button>
    <div class="container" ref="container"></div>
</template>
<script setup lang="ts">
    // 保存数据
    const saveGraphData = () => {
        const graphData = lf.getGraphData();
        console.log("保存数据:", graphData)
    };
</script>
7. 事件 Event
当我们使用鼠标或其它方式与画布交互时,会触发的对应的事件。 通过监听这些事件,可以获取其在触发时所产生的数据,根据这些数据来实现需要的功能。详细可监听事件见 事件 API